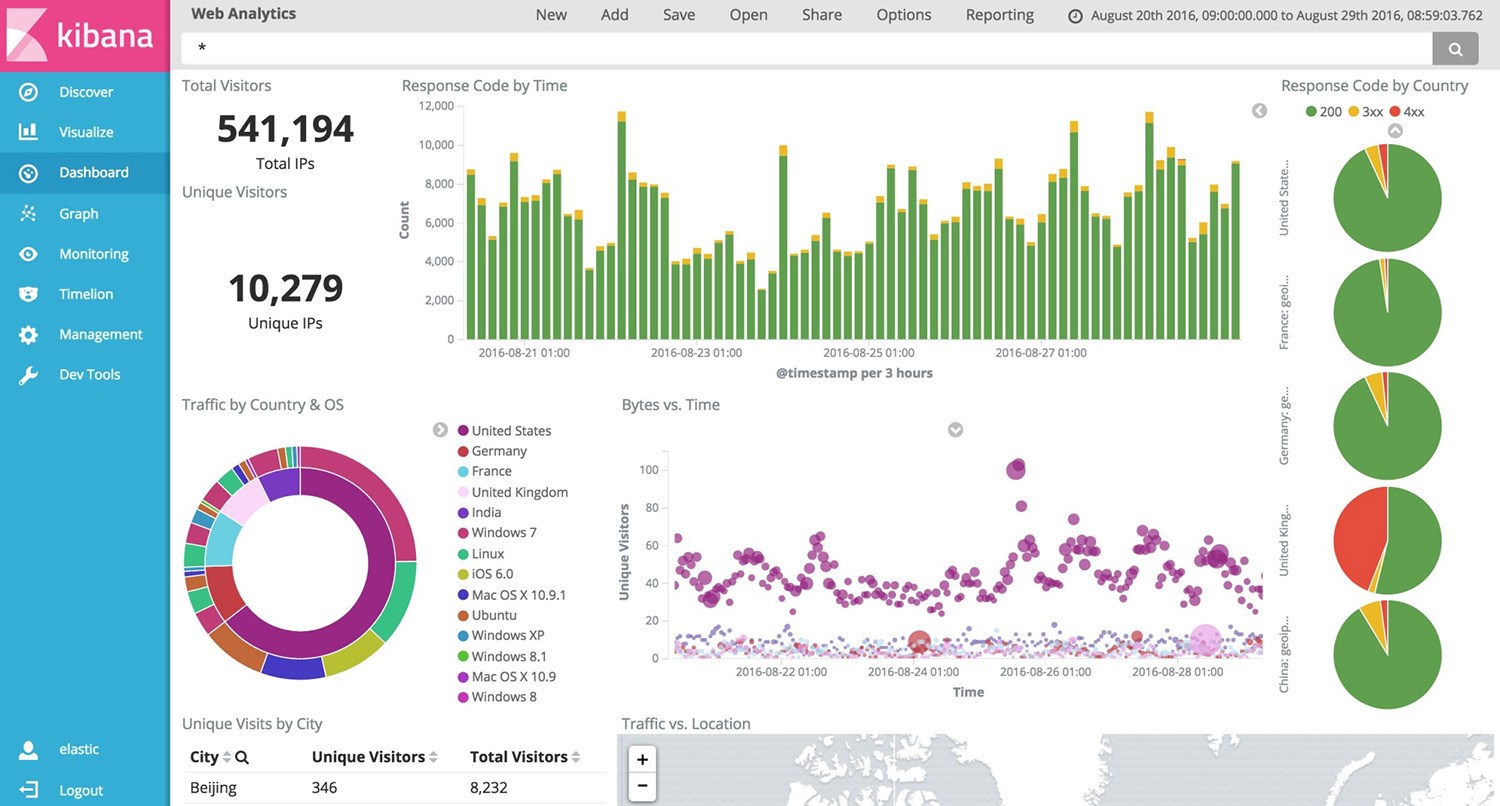
In the world of containerization, Docker has emerged as a popular choice for packaging and deploying applications. However, effectively managing and analyzing logs generated by Docker containers can be a challenging task. That’s where the power of the Elasticsearch Fluentd Kibana (EFK) stack comes in. By combining these three robust technologies, Docker logging becomes a streamlined and efficient process. In this article, I will share the docker-compose file for the EFK stack and explore how it enables centralized log management, real-time log processing, and insightful visualization. Whether you’re a developer, DevOps engineer, or system administrator, understanding Docker logging with the EFK stack is crucial for ensuring the availability, performance, and troubleshooting of containerized applications.
First of all, why is Fluentd not Logstash(ELK)? Fluentd is lite and fast! “Fluent Bit” is faster with fewer filtering features.
Using docker-compose we can have containers for Elasticsearch, Fluentd, Kibana, and Containers for my actual nodejs app.
Here is an example docker-compose.yml file
  version: "2.1"
services:
  myapp:
    build: ./myapp
      #docker network
      networks: ['stack']
      restart: unless-stopped
      ports: ['3000:3000']
      depends_on: ['fluentd']
      healthcheck:
        test: ["CMD", "curl", "-s", "-f", "https://localhost:3000/"]
        retries: 6
      logging:
        driver: "fluentd"
        options:
          fluentd-address: ${FLUENTD_HOST}:24224

  #Elasticsearch
  elasticsearch:
    hostname: elasticsearch
    image: "docker.elastic.co/elasticsearch/elasticsearch:${ELASTIC_VERSION}"
    environment:
      - http.host=0.0.0.0
      - transport.host=127.0.0.1
      - bootstrap.memory_lock=true
      - "ES_JAVA_OPTS=-Xms${ES_JVM_HEAP} -Xmx${ES_JVM_HEAP}"
    mem_limit: ${ES_MEM_LIMIT}
    ulimits:
      memlock:
        soft: -1
        hard: -1
    volumes:
      - ./config/elasticsearch.yml:/usr/share/elasticsearch/elasticsearch.yml
      - esdata:/usr/share/elasticsearch/data
    ports: ['9200:9200']
    #Healthcheck
    healthcheck:
      test: ["CMD", "curl","-s" ,"-f", "-u", "elastic:${ES_PASSWORD}", "https://localhost:9200/_cat/health"]
    #docker network
    networks: ['stack']
    restart: unless-stopped

  #Kibana
  kibana:
    container_name: kibana
    hostname: kibana
    image: "docker.elastic.co/kibana/kibana:${ELASTIC_VERSION}"
    volumes:
      - ./config/kibana.yml:/usr/share/kibana/kibana.yml
    #Port 5601 accessible on the host
    ports: ['5601:5601']
    #docker network
    networks: ['stack']
    #Wait for ES instance to be ready
    depends_on: ['elasticsearch']
    environment:
      - "ELASTICSEARCH_PASSWORD=${ES_PASSWORD}"
    healthcheck:
      test: ["CMD", "curl", "-s", "-f", "https://localhost:5601/login"]
      retries: 6

  #fluentd
  fluentd:
    container_name: fluentd
    hostname: fluentd
    build: ./fluentd
    volumes:
      - ./fluentd/conf:/fluentd/etc
    depends_on: ['elasticsearch']
    #docker network
    networks: ['stack']
    environment: ['ELASTIC_VERSION=${ELASTIC_VERSION}','ES_PASSWORD=${ES_PASSWORD}']
    restart: unless-stopped
    ports:
      - "24224:24224"
      - "24224:24224/udp"
      - "42185:42185"
      - "42185:42185/udp"
      - "24230:2423"

volumes:
  #Es data
  esdata:
    driver: local

networks: {stack: {}}
Here configured fluentd logger driver of docker.
You can even log host machine with td-agent running in the host can send logs to fluentd container.
Fluentd Docker image file ./fluentd/Dockerfile
FROM fluent/fluentd:v0.12-debian
ENV ES_USERNAME ${ES_USERNAME}
ENV ES_PASSWORD ${ES_PASSWORD}
ENV ES_HOST ${ES_HOST}
RUN ["gem", "install", "fluent-plugin-elasticsearch", "--no-rdoc", "--no-ri", "--version", "1.10.0"]
